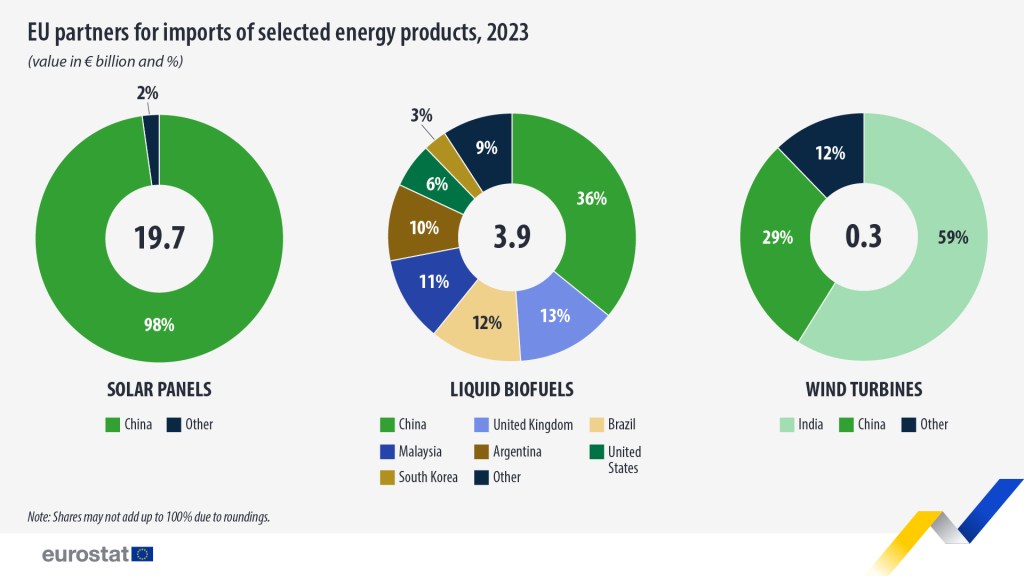
The European Union imported €19.7 billion worth of solar panels from extra-EU countries in 2023, new data has shown.
Imports of solar panels were up 5% in volume terms, but were 12% down in value terms due to lower prices, the Eurostat data showed.
In addition, the EU imported €3.9 billion worth of liquid biofuels – a 22% drop in value imports, and a 2% decline in volume – and €0.3 billion worth of wind turbines, down 66% in value and 68% in volume terms.
China the biggest supplier
China was by far the largest supplier of solar panels to the European Union accounting for 98% of all imports.
Wind turbines were imported mainly from India (59%) and China (29%). In terms of liquid biofuels, meanwhile, China led with 36%, followed by the United Kingdom with 13% and Brazil with 12%.
Green energy exports
In terms of exports, the bloc exported €0.9 billion worth of solar panels, €2.2 billion in liquid biofuels, and €2.0 billion in wind turbines, with the latter significantly exceeding import values.
Between 2022 and 2023, wind turbine exports saw the largest growth, Eurostat’s data showed, with a 49% increase in value and a 26% rise in quantity. Solar panel exports increased by 19% in value and 37% in quantity. Liquid biofuel exports also showed notable growth, with a 36% rise in value and a 63% increase in quantity, reflecting stronger demand for larger volumes. Read more here.
Imports of selected energy products to EU (2023)
| Product | Partner | Value (€ billion) | Percentage (%) |
|---|---|---|---|
| Solar Panels | Extra-EU | 19.7 | |
| China | 19.2 | 98% | |
| Other | 0.5 | 2% | |
| Liquid Biofuels | Extra-EU | 3.9 | |
| China | 1.4 | 36% | |
| United Kingdom | 0.5 | 13% | |
| Brazil | 0.5 | 12% | |
| Malaysia | 0.4 | 11% | |
| Argentina | 0.4 | 10% | |
| United States | 0.2 | 6% | |
| South Korea | 0.1 | 3% | |
| Other | 0.4 | 9% | |
| Wind Turbines | Extra-EU | 0.3 | |
| India | 0.2 | 59% | |
| China | 0.1 | 29% | |
| Other | 0.0 | 12% |