

Luxembourg boasts the highest share of foreign-controlled businesses in the European Union, with 28% of all firms owned by non-domestic entities, new data from Eurostat has found.
Estonia boasts the second-highest share of foreign controlled businesses in the EU, at 11%, while in other member states, foreign-controlled enterprises represent less than 5% of the total, with shares ranging from as low as 0.3% in Poland and Italy to 5% in Croatia.
According to the data, overall, just 1% of European Union enterprises were under foreign control in 2023, with some 60% controlled by institutional entities from other EU countries, while 40% of owners resided outside the EU.
Value added by foreign-owned businesses
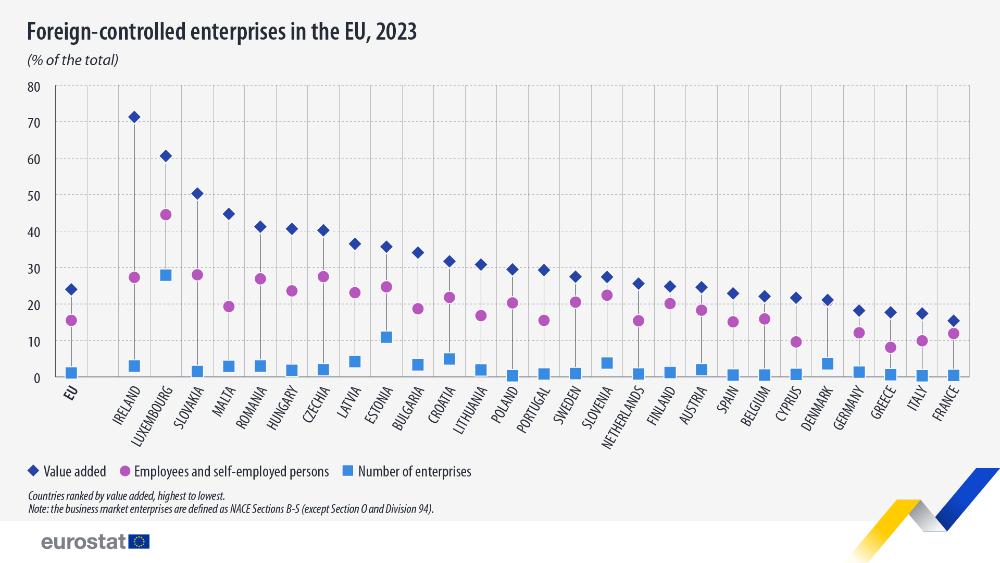
While the share of foreign-owned businesses is low in many EU countries, their contribution in terms of employment, and particularly value added, is ‘significant’, Eurostat said.
At an EU level foreign-owned businesses employ 16% of the working population, and their share of total value added represents 24% of the EU total.
In several member states, their influence is particularly notable – in Ireland, for example, value added by foreign-controlled enterprises represents 71% of the total, followed by Luxembourg (61%) and Slovakia (50%).
In terms of employees, meanwhile, foreign-controlled enterprises represented close to half (45%) of jobs in Luxembourg, followed by 28% in both Slovakia and Czechia.
As regards the total number of foreign-owned businesses operating in each EU member state, Germany boasts the highest number of foreign-controlled enterprises, with more than 38,000, followed by Romania and Czechia. Read more here.
Number of Foreign-Controlled Enterprises by EU Member State
| Country | Number of Enterprises |
|---|---|
| Germany | 38,483 |
| Romania | 28,566 |
| Czechia | 23,971 |
| France | 19,505 |
| Netherlands | 18,129 |
| Spain | 16,057 |
| Estonia | 15,316 |
| Hungary | 15,008 |
| Italy | 14,087 |
| Luxembourg | 13,219 |
| Bulgaria | 13,192 |
| Austria | 12,650 |
| Ireland | 12,579 |
| Denmark | 12,419 |
| Croatia | 11,438 |
| Portugal | 10,535 |
| Slovakia | 9,795 |
| Sweden | 8,708 |
| Poland | 8,590 |
| Slovenia | 7,644 |
| Lithuania | 6,362 |
| Latvia | 6,213 |
| Finland | 5,303 |
| Greece | 4,857 |
| Malta | 1,727 |
| Belgium | 910 |
| Cyprus | 488 |